
 Zhejiang Hongyan Electric Co., Ltd.
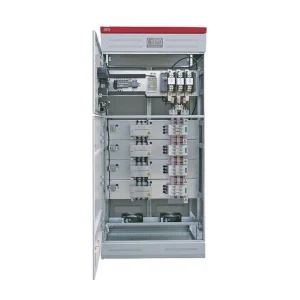
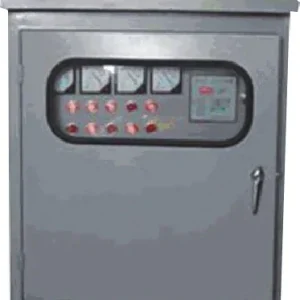
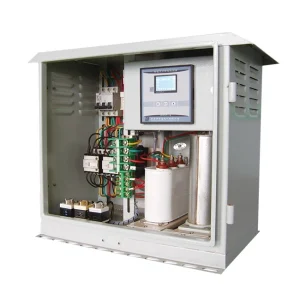
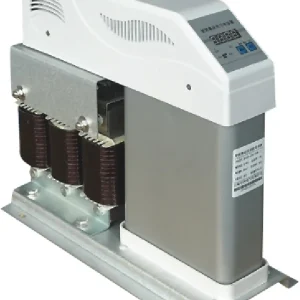
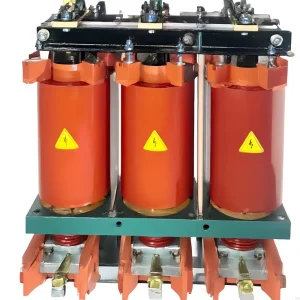
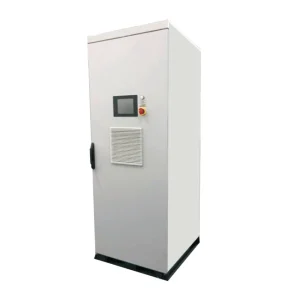
Advantages of power quality monitoring start with evidence: a recorder timestamps sags, harmonics, imbalance, and power-factor drift so a plant can name the event before it buys a filter, a capacitor bank, or sag support.
A night-shift trip that no one saw is the usual prompt. The log answers whether the incoming board dipped, a drive dumped harmonic current, or reactive demand swung — and whether a two-week hire would have missed it.
That is what is power quality monitoring on a plant bus. The rest of this page covers campaign versus continuous recording, how to read the event class, where the first recorder goes, and which printed CHYN cabinet the evidence actually supports.
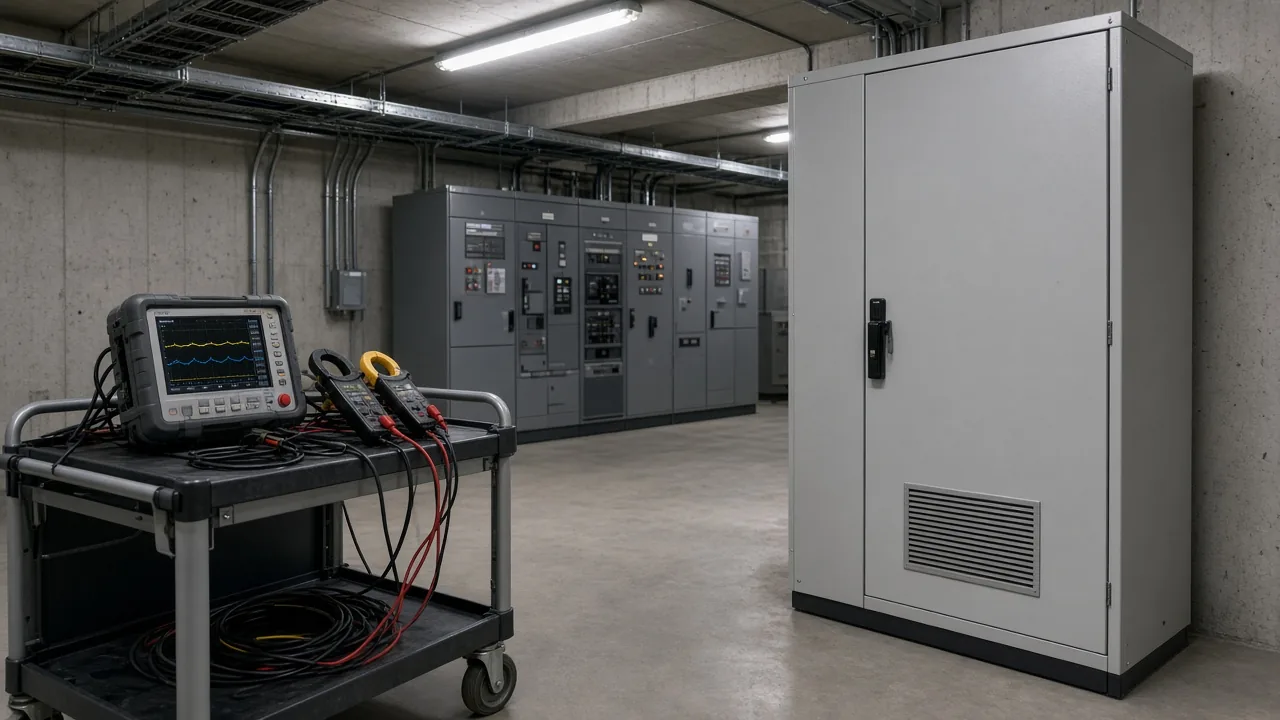
What Power Quality Monitoring Actually Records on a Plant Bus
Power quality monitoring records voltage and current waveform characteristics — RMS variations, harmonics, imbalance, transients, and power factor — so the plant can see deviations from a nominal sine instead of only a kilowatt-hour total.
An energy meter answers how many kilowatt-hours moved. A power quality monitoring device watches the shape of the same supply: whether the sine stayed clean, whether the three phases stayed even, and whether a short event hit a drive or a contactor.
IEEE 1159 gives that event vocabulary a common set of names. IEC 61000-4-30 describes how those measurements should be made, including current as well as voltage in later editions.
| Quantity | What the recorder keeps | Plant use |
|---|---|---|
| RMS voltage and current | Steady level plus short variations | Spot overload, undervoltage, or a dip that lasts cycles |
| Harmonic distortion / THD | Extra frequencies on the waveform | See whether drives and rectifiers are heating transformers |
| Voltage unbalance | Unequal phase voltages | Find motors that run hotter on one winding |
| Transient | High-speed impulse or spike | Catch switching or lightning events an energy meter ignores |
| Power factor | Real power versus apparent power | See lagging reactive demand on the same file |
Power quality monitoring equipment is that recorder plus the clamps or instrument transformers that feed it. The purpose of a power quality meter is to keep those traces long enough to explain a trip, not to replace a revenue meter.
Why Plants Monitor Instead of Guessing From Symptoms
Symptoms such as a tripped drive or a hot transformer do not name the event class; monitoring names the objective first and then timestamps whether the disturbance came from a sag, a harmonic current, or a reactive swing.
A packaging line that drops when a nearby mill motor starts looks like “dirty power.” Without a log, the buyer can spend the next month arguing about a filter, a capacitor bank, or a utility complaint that none of those cabinets would have fixed.
CIGRE and CIRED working-group practice starts with the objective: compliance, site characterisation, troubleshooting, or an ongoing performance log. That choice decides whether the plant hires a temporary / campaign survey or installs a permanent / continuous monitor.
Tip: A site survey exists so the plant buys line-conditioning from facts. A short or badly placed survey that then funds the wrong cabinet is worse than no survey — NIST, Monitoring Power Quality.
Many events start inside the plant: load switching, ground faults, and nonlinear loads. Looking only at the utility feeder misses the drive that collapsed the bus on the same switchboard.
When a Campaign Survey Is Enough and When Continuous Monitoring Pays Off
A portable campaign can characterise a known complaint in days or weeks; a continuous monitor is the advantage when events are rare, seasonal, or needed as an ongoing log, because a short survey can miss the disturbance that actually trips the line.
A temporary campaign survey fits a defined question: a new VFD is arriving, one MCC is tripping, or a consultant needs a background harmonic file before a filter study. The box leaves when the file is complete.
A power quality monitoring system that stays on the incoming board is the other path. It keeps the next unexplained weekend trip, the seasonal lightning week, and the slow drift in power factor that a two-week hire never sees.
| Approach | Typical stay | Strength | Blind spot |
|---|---|---|---|
| Temporary campaign survey | Days to a few weeks | Cheap way to characterise a known complaint | Misses events outside the window |
| Rotating portable units | Weeks per site, then move | Covers more boards with fewer boxes | Still a sample, not a continuous log |
| Permanent continuous monitor | Fixed installation | Catches rare sags and builds a trend | Costs more; still fails if the location or mode is wrong |
A two-week hire can see steady harmonics and unbalance, then miss the sag that happens the week after the crew packs up.
The advantage is not “more data.” It is a log that matches the question the plant is actually trying to close.
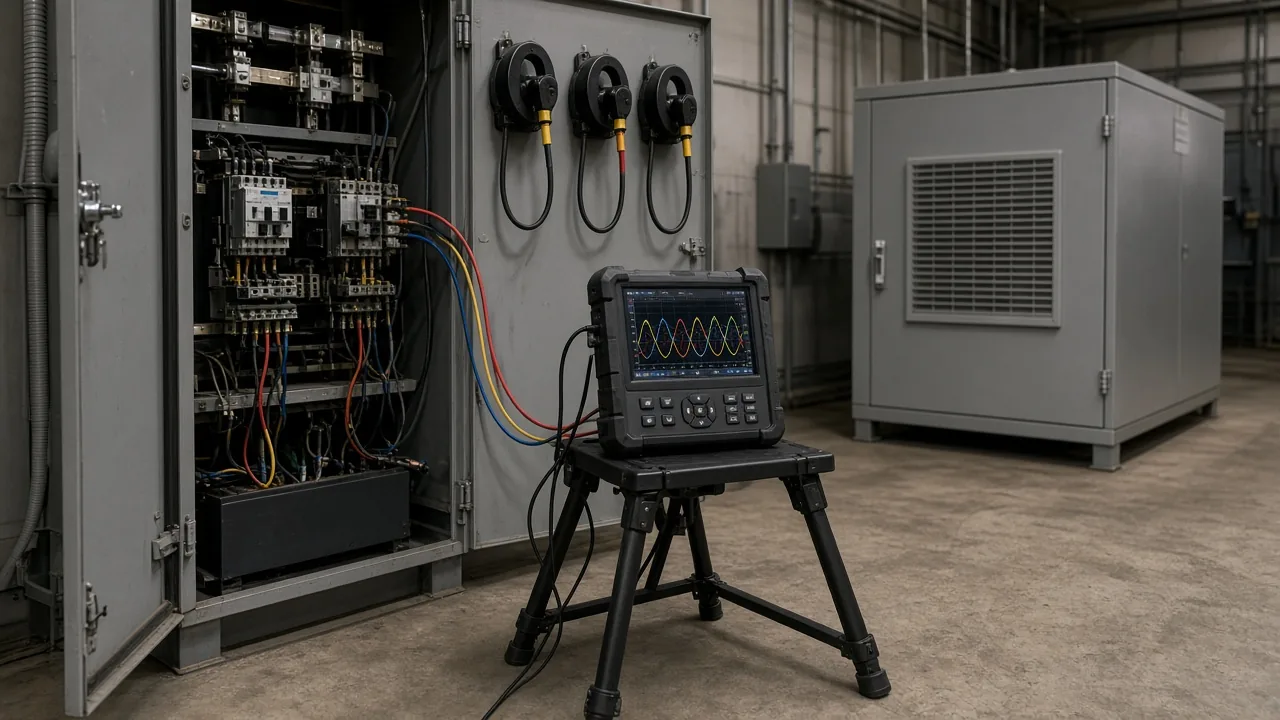
What Sag, Swell, and Transient Logs Change on the Floor
A sag, swell, or transient log tells the plant the magnitude and duration of a short voltage event, which is a different buying problem from chronic THD and points toward ride-through or sag-support equipment rather than a harmonic filter.
A voltage sag is a short drop in RMS voltage, commonly described as 10 to 90 percent below nominal for half a cycle to one minute. A voltage swell is the opposite rise, commonly 10 to 80 percent above nominal for the same window.
Those windows matter on the floor. A packaging robot that drops when a mill motor starts is often a sag lasting a few cycles, not a harmonic-distortion problem. Buying an active filter for that log wastes the next purchase.
A transient is faster still — an impulse or spike from switching or lightning. Energy meters do not keep that trace. Only a recorder with enough sample rate sees it.
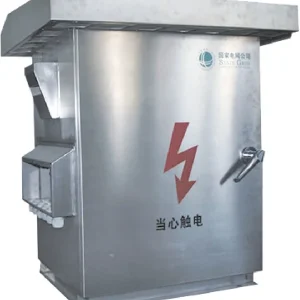
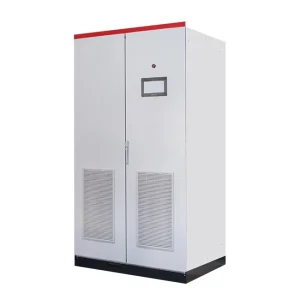
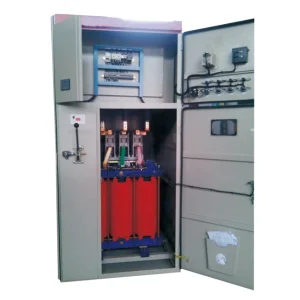
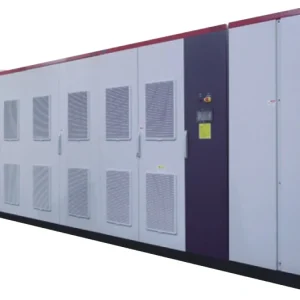
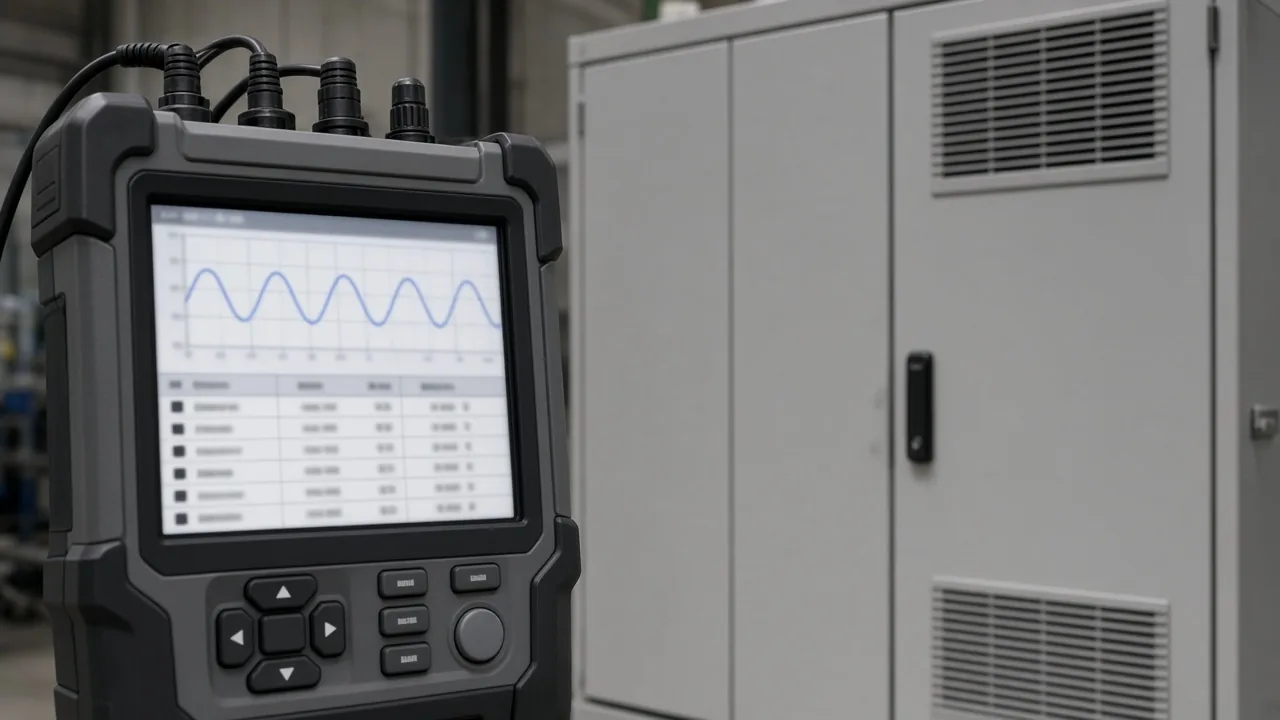
When the event file is sag or interruption on a sensitive load, the printed CHYN path is the HYDVR series voltage sag mitigation solution, a dynamic voltage restorer for short-duration voltage sags and interruptions. It is not a harmonic filter and it is not a capacitor bank.
What Harmonic and Imbalance Evidence Changes in Maintenance
Harmonic and unbalance recordings show whether nonlinear loads or unequal phases are heating transformers and motors, and they only support a filter decision when the survey duration and instrument-transformer bandwidth match the orders that matter.
Harmonic distortion is the extra frequencies that VFDs, rectifiers, and other electronic supplies add to a 50 or 60 hertz sine. Maintenance sees it as hot transformers, buzzing capacitors, or nuisance trips that repeat when the drive fleet is busy.
Current and voltage at the point of common coupling are usually judged against IEEE 519. Plants that only record to the 40th order while a study asks for the 50th are answering a thinner question than the contract wrote.
Instrument transformers can filter those higher orders. A water-plant thread on Eng-Tips walked through exactly that: a new 4160 V drive, a one- or two-day plan, and replies that said measure background first and check whether the CTs and VTs can even see the orders IEEE 519 cares about.
Unequal phase voltages force unequal motor current and heat one winding harder than the others. Voltage unbalance belongs on that maintenance file, not on a harmonic-filter RFQ.
How Monitoring Evidence Chooses HYAPF, a Capacitor Bank, or HYDVR
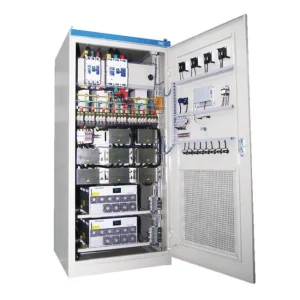
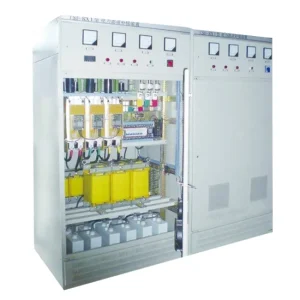
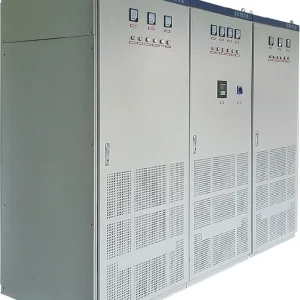
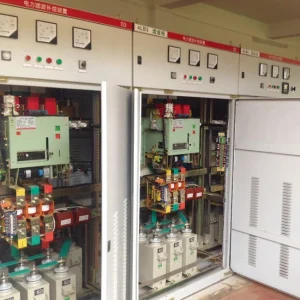
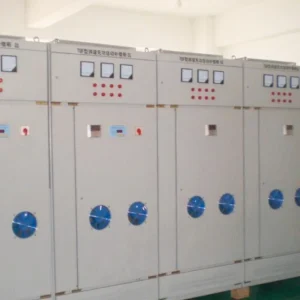
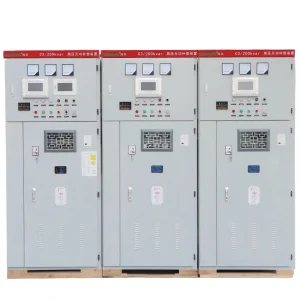
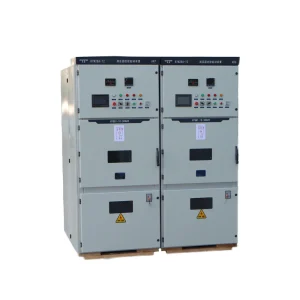
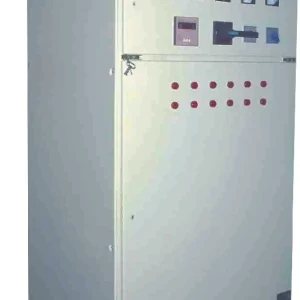
Measured changing harmonic current on an LV bus maps to HYAPF; measured lagging or fluctuating reactive demand maps to HYTBBJ or HYTBBD; measured short-duration sags map to HYDVR; the products hub is the family map, not a meter catalog.
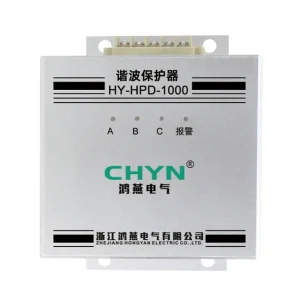
CHYN does not publish a branded power quality meter on the live products hub. The first-party outcome of the log is a correction class.
| Event class on the log | First printed path | Why that cabinet |
|---|---|---|
| Changing harmonic current on an LV bus | HYAPF Series Active Power Filter | Injects an equal, opposite harmonic current |
| Steady inductive / lagging power factor | HYTBBJ | Switches capacitor groups by measured reactive demand |
| Large inductive-load variation | HYTBBD | Dynamic path when reactive demand swings |
| Short-duration sags or interruptions | HYDVR | Sag support for sensitive loads |
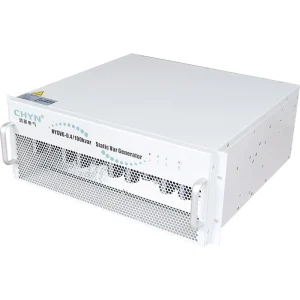
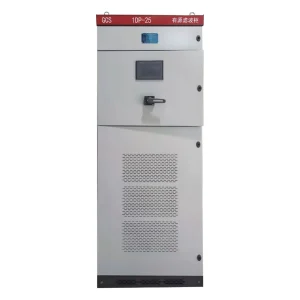
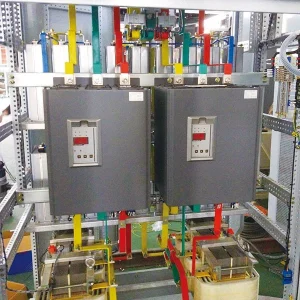
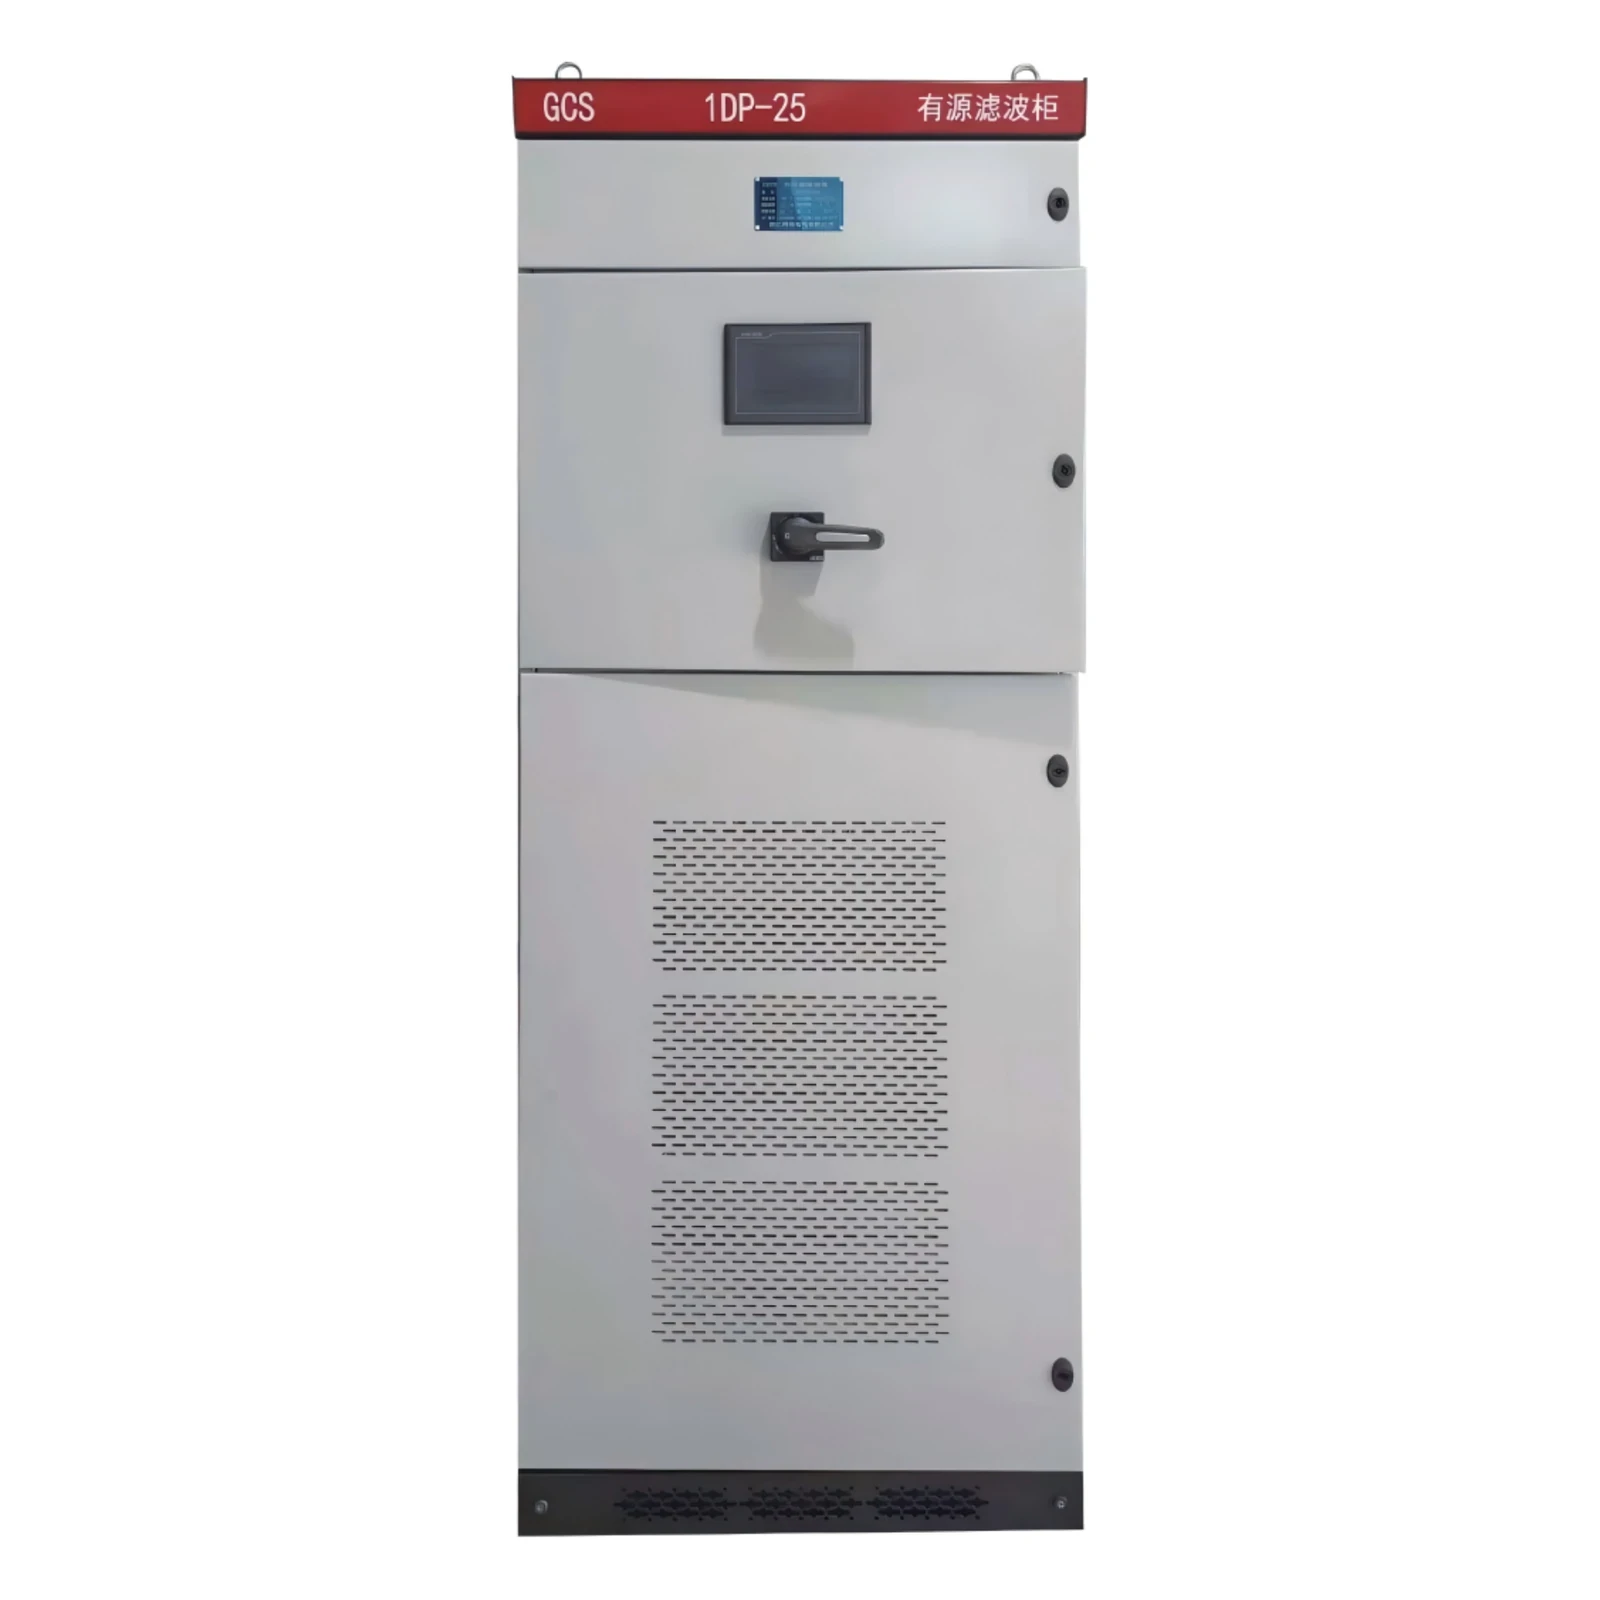
The HYAPF Series Active Power Filter measures load current in real time and injects an equal, opposite harmonic current into low-voltage distribution networks. Printed ratings include 400 V / 690 V, a 2nd–51st order range, response under 10 ms, and control accuracy stated as THD under 5 percent.
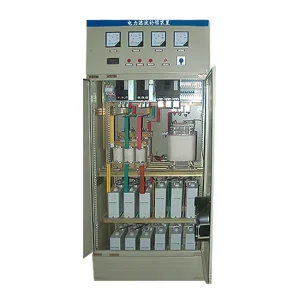
HYTBBJ / HYTBBD stay on the reactive side of the same decision. HYTBBJ automatically switches capacitor groups according to measured reactive demand when the inductive load is relatively steady. HYTBBD is the printed path for industries with large variations in inductive load.
Leave AHF-versus-passive architecture and capacitor-bank how-tos on the pages that already own them. This page only uses the log to pick the class.
Where the First Recorder Goes and What It Must Be Able to See
The first recorder usually sits on the incoming switchboard, with a second unit on the board that serves the failing load, and both need enough bandwidth and the right mode to see the event class the plant actually cares about.
The point of common coupling — the main incoming switchboard — is the usual first location. That file shows what the utility and the whole plant share. It does not show a sag that lives only on one downstream MCC.
From the field: One instrument typically goes on the main incoming switchboard; extra units go on the section being metered, and swell, sag, or high-speed transient functions cost more than basic steady-state metering — Eng-Tips, Power Quality Meter Location.
If only one machine is failing, put a second recorder on that panel. A campaign left in the wrong mode misses the event: transient-only misses slow voltage drift, and a wide default threshold can hide the dip that actually dropped the line.
Match duration and bandwidth to the question. A one-day harmonic file on a constant load can be enough for a background check. A rare sag needs a box that stays, and a study that cites IEEE 519 to the 50th needs instrument transformers that can still see those orders.
FAQ
What is the purpose of a power quality meter?
A power quality meter records waveform events — sags, swells, transients, harmonics, unbalance, and power factor — so the plant can name the disturbance that tripped a load. It is not a substitute for a revenue energy meter.
What is a power quality monitoring device?
It is a portable analyzer or a fixed monitor, plus the clamps or instrument transformers that feed it. Portable units serve a campaign; fixed units stay on an incoming board or a critical MCC.
How do you measure power quality on a plant bus?
Install the recorder at the incoming switchboard and, if one machine is failing, on that load’s panel. Capture voltage and current, set thresholds for the event class you care about, and leave the box up long enough to see that class.
What are the advantages of power quality monitoring?
The advantages of power quality monitoring are a timestamped event class, a campaign-versus-continuous choice that matches how rare the event is, and a buying path that follows the log instead of a guess.
Is a two-week survey enough, or do I need a permanent monitor?
A two-week temporary campaign survey is enough when the complaint is already happening and the load is representative. Use a permanent continuous monitor when events are rare, seasonal, or needed as an ongoing performance log.
Where should the first power quality monitor go?
Start at the incoming switchboard. Add a second recorder on the board that serves the failing load if the incoming file does not show the event.
Can monitoring tell me whether I need a filter or a capacitor bank?
Yes, if the file names the class. Changing harmonic current points to a filter such as HYAPF, while lagging or swinging reactive demand points to HYTBBJ or HYTBBD.
A sag log points to HYDVR, not to a capacitor bank.
How long should a harmonic survey run, and to which order?
Run it long enough to cover the operating modes that create the current, and record to the order the study actually uses. IEEE 519 commonly considers harmonics through the 50th; a one- or two-day file to the 40th may be too thin, and CTs or VTs can hide the higher orders.
References
- Wikipedia — Electric power quality
- IEEE SA — IEEE 1159-2019, Recommended Practice for Monitoring Electric Power Quality
- CIGRE/CIRED JWG C4.112 — Power Quality Monitoring
- NIST — Monitoring Power Quality (Martzloff & Gruzs)
- Eng-Tips — Power Quality Meter Location
- Eng-Tips — Harmonic analysis: sources to measure and for how long