
 Zhejiang Hongyan Electric Co., Ltd.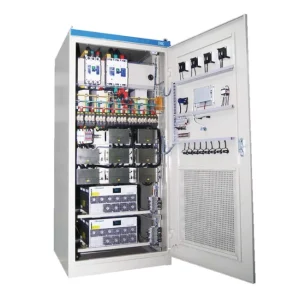
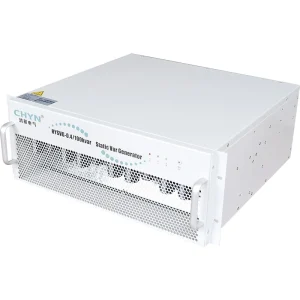
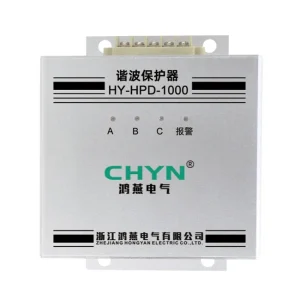
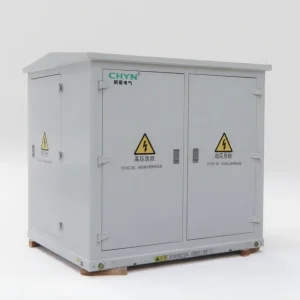
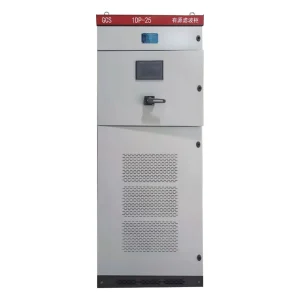
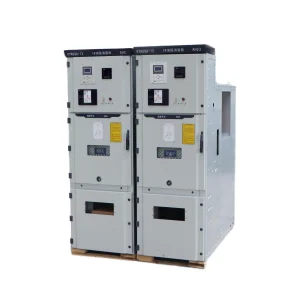
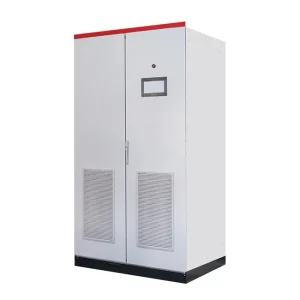
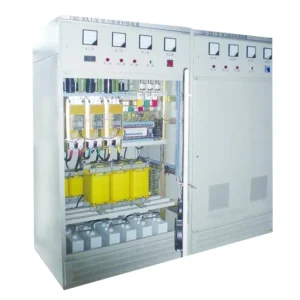
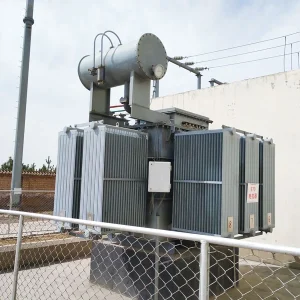
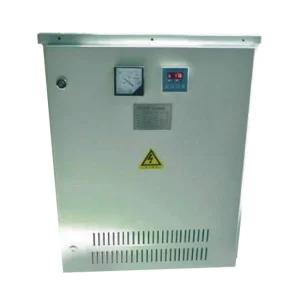
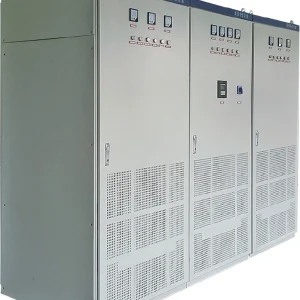
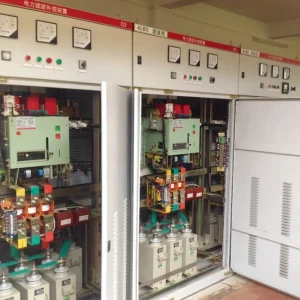
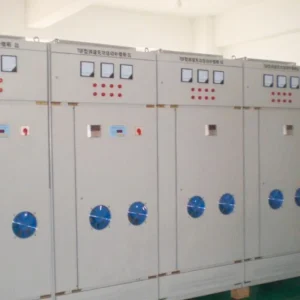
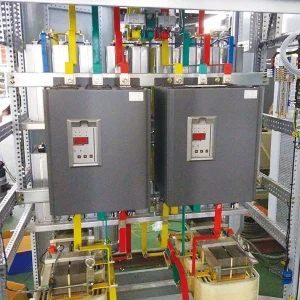
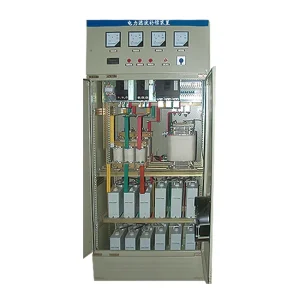
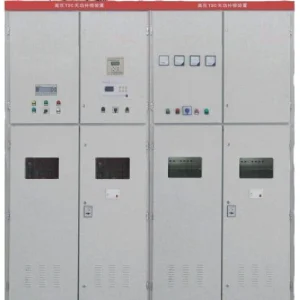
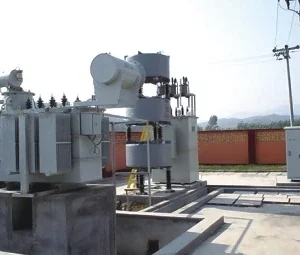
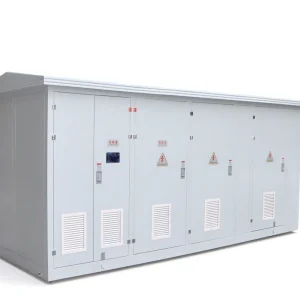
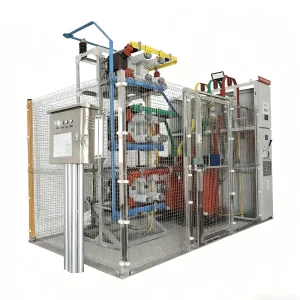
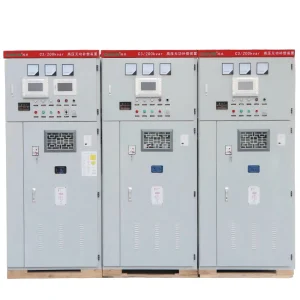
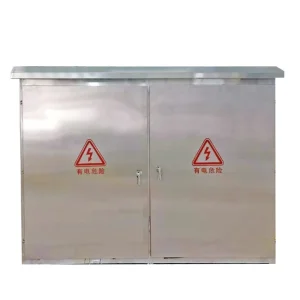
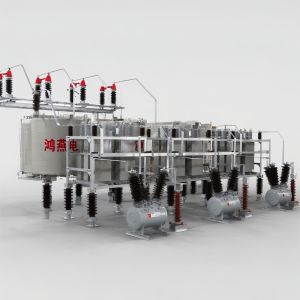
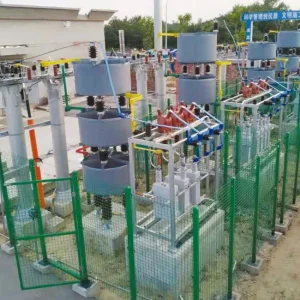
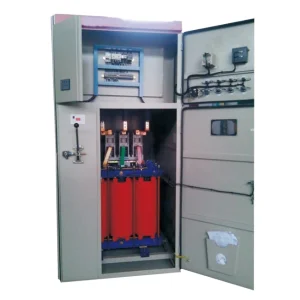
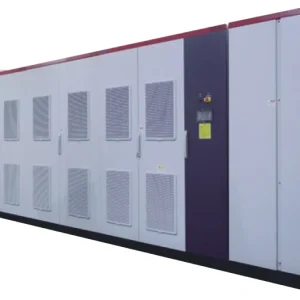
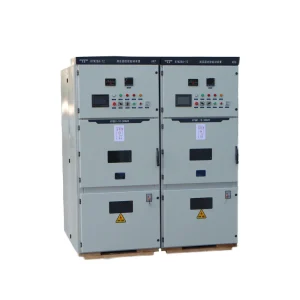
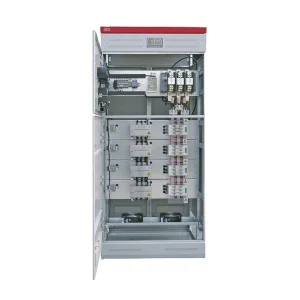
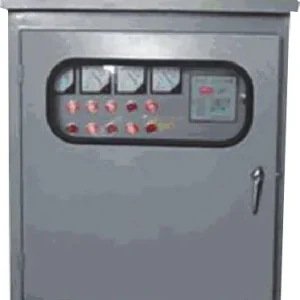
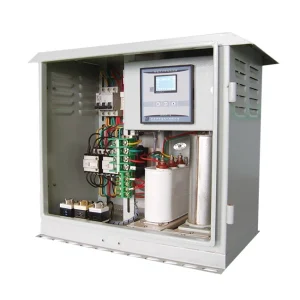
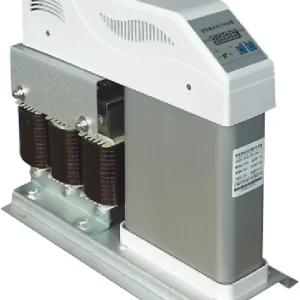
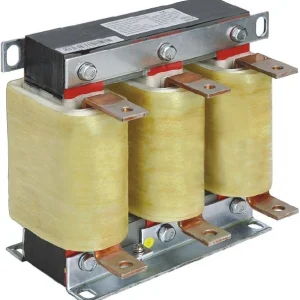
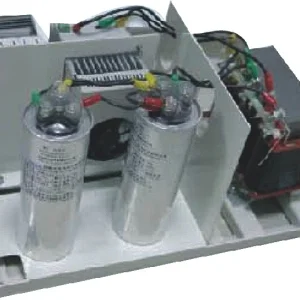
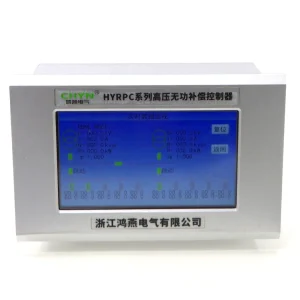
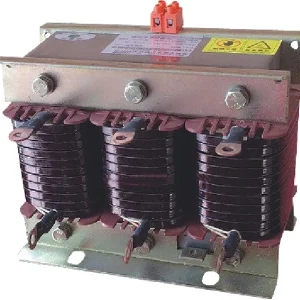
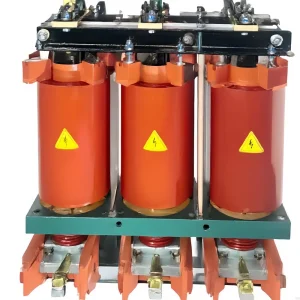
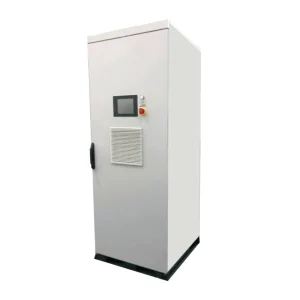
Data center power quality management software, meters, and EPMS archive and classify harmonics, sag events, and power factor; they do not inject compensating current or vars. Visibility is enough until a bus still misses a PCC or equipment goal, and then AHF, SVG, or DVR belongs on that section. The layers below, the UPS/IT/cooling cues in the historian, and the hardware path after measurement are how that call is made.
Power remains the leading reported cause of impactful data-center outages in Uptime Institute’s 2025 analysis, as Data Center Knowledge states 54% of cases. That survey still does not turn a dashboard into an injector. The products hub holds CHYN hardware catalogs; the buyer job is whether a meter or dashboard is enough, or whether AHF, SVG, or DVR must sit on the bus.
What data center power quality management software actually stores
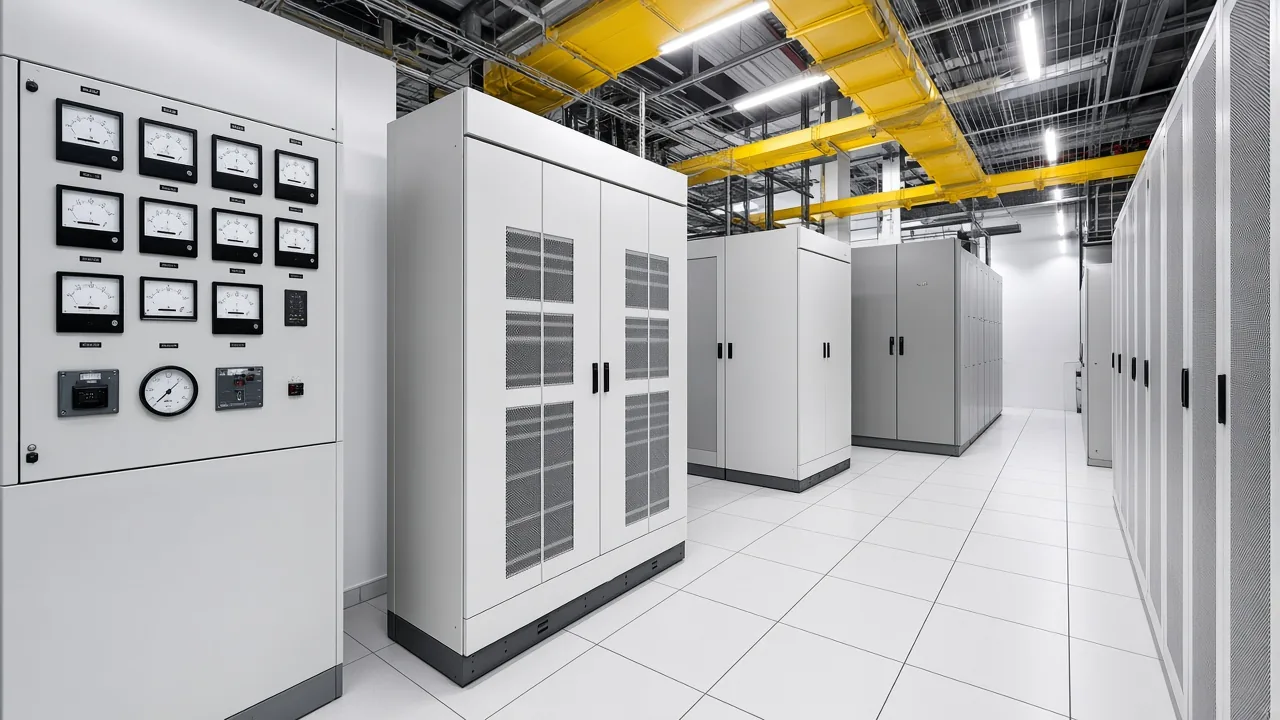
It archives and classifies events, COMTRADE / PQDIF files, and standard reports; it does not inject current or vars. Data-center PQ management software is the historian that keeps waveforms, RMS variations, and topology-tied event tags so someone can ask why a feeder sagged last Tuesday.
Monitoring answers what happened. Management software adds classification and a next-step narrative, still on recorded files. Hardware that injects current, vars, or series voltage is a third layer those files cannot perform.
Concentrators import IEEE COMTRADE fault records and IEEE 1159.3 PQDIF packages, then score them against templates such as EN 50160. Operators also pipe a Power quality meter / analyzer onto Modbus so reactive power and harmonic channels land in the same historian.
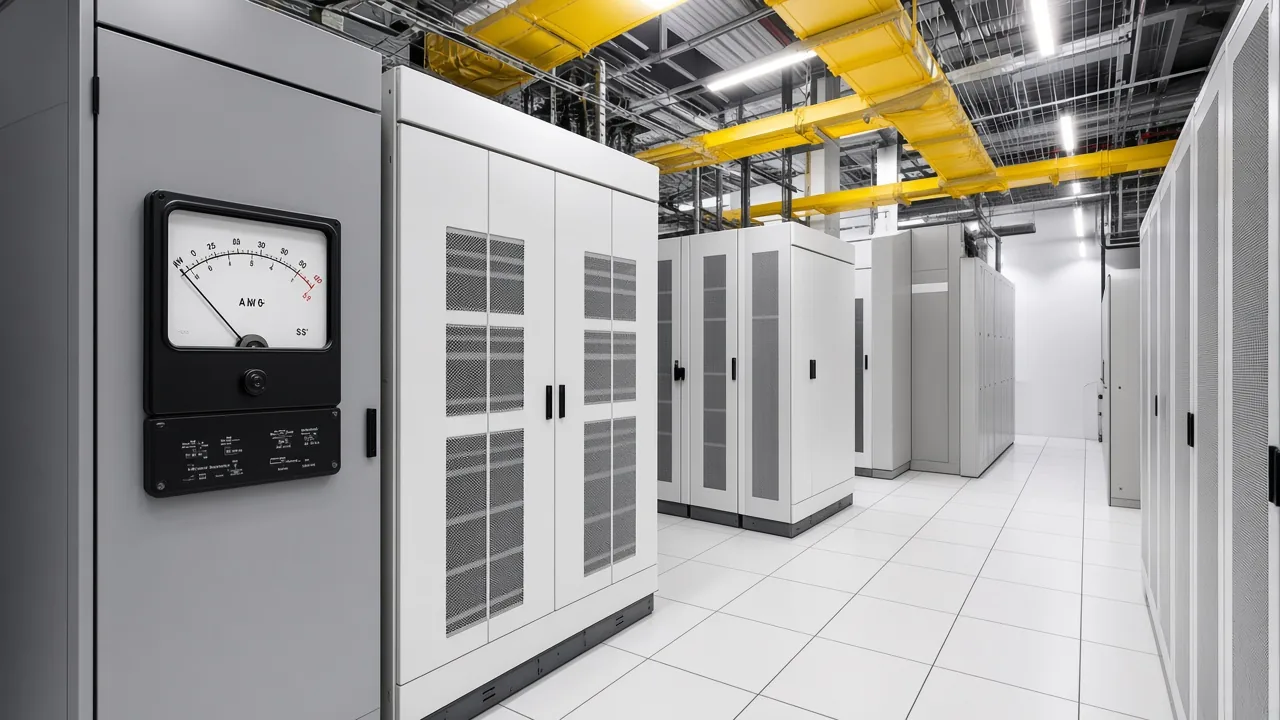
A rental logger for a month is the same class of tool: it stores, it does not cancel distortion. If the screen looks complete and THD, sag depth, or PF still miss the design goal, the missing object is an injector, not another report pack.
How EPMS, DCIM, BMS, and a PQ analyzer split the job
EPMS watches the electrical path; DCIM is white-space/capacity; BMS owns cooling loops; a power quality analyzer feeds them all. Buying DCIM because invoices need cabinet kWh does not place an active filter on the bus.
| Layer | What it owns | What it cannot do |
|---|---|---|
| PQ analyzer / Class A or S meter | Capture voltage, current, events, and files | Inject compensating current or vars |
| EPMS | Electrical OT from incomer to PDU, high-resolution PQ events | Replace shunt or series correction cabinets |
| DCIM | White-space capacity, rack ops, often kWh bill-back | Control plant or cancel harmonics |
| BMS | Mechanical and environmental control loops | Serve as the electrical event recorder |
| AHF / SVG / DVR | Inject current, vars, or series voltage on a named bus | Substitute for a missing measurement campaign |
EPMS is the electrical monitoring system, not the cooling BMS. It timestamps milli-second class electrical events that slow BMS polling would miss.
DCIM should consume EPMS and BMS. Community threads that ask which DCIM to use for UPS and PDU invoicing are bill-back jobs, not harmonic-injection jobs.
A cheap UPS keeps loads alive and can still overlay a poor waveform; double-conversion remakes a sine. Neither fact chooses an AHF, SVG, or DVR cabinet. Facility-type contrasts among buildings, halls, and hospitals live on the large-building data-center and hospital shortlist.
What UPS rectifiers, IT PSUs, and cooling VFDs write into the historian
Nonlinear UPS/IT/cooling current shows up as harmonics, PF swing, and sag timestamps—not as a software defect. The data center and telecom power quality solution names UPS rectifiers, server PSUs, cooling drives, and redundant paths as the load mix that drives AHF plus SVG on UPS-intensive buses.
An UPS rectifier / IT PSU pair draws non-sinusoidal current. Aggregated across a hall, that current writes harmonic orders into the meter even when the voltage at a stiff source looks clean.
Cooling VFD current from chillers and AHUs shares the same LV sections. PF hunts when those drives ramp, and capacitor steps chatter if someone tries to chase that swing with APFC / capacitor steps alone.
Redundant path transfers and generator mode change source impedance. The historian then fills with sag timestamps and a different THD picture; the files still only describe the event.
Harmonics versus voltage-stability as a paired deep dive already sits on the harmonics and voltage-stability solutions page. Those same loads still need a meter-versus-injector call, not a facility-type matrix.
When a meter campaign or software archive is enough
A Class A/S or IEEE 1159 campaign, rental logger, or EPMS archive is enough when the job is measurement, compliance reporting, or forensics. The software stack earns its keep while you still need to know what the bus did.
IEC 61000-4-30 defines Class A and Class S measurement methods for 50/60 Hz systems, not harmonic emission limits. Class A is how contracts want the measurement done; it is not an AHF nameplate.
IEEE 1159 is the monitoring recommended practice: devices, application technique, and how to read the record. A field habit is to rent a power quality monitor, leave it, and return after a campaign interval, or to stream THD and vars from a meter over Modbus.
Confirm distortion against UPS and PDU trip settings as well as against IEEE 519 at the PCC. Equipment guidance cited in data-center harmonic troubleshooting often sits near 5% voltage THD and 20% current THD.
IEEE 519-2022 at the PCC uses about 8% voltage THD and a higher current band, around 20%; the equipment fence and the PCC fence are not the same object.
Keep the campaign when the waveform already meets the PCC and equipment goals, when you need an archive for a dispute, or when you are still isolating upstream versus load with harmonic-power sign. Add hardware when the same measurements keep showing a miss after the files are in order.
When to choose AHF, SVG, or DVR instead of another dashboard
Choose AHF when harmonic current must be cancelled, SVG when vars must move without capacitor steps, DVR when series voltage must be injected during a sag. Another dashboard repeats the log; it does not change the current or voltage the load sees.
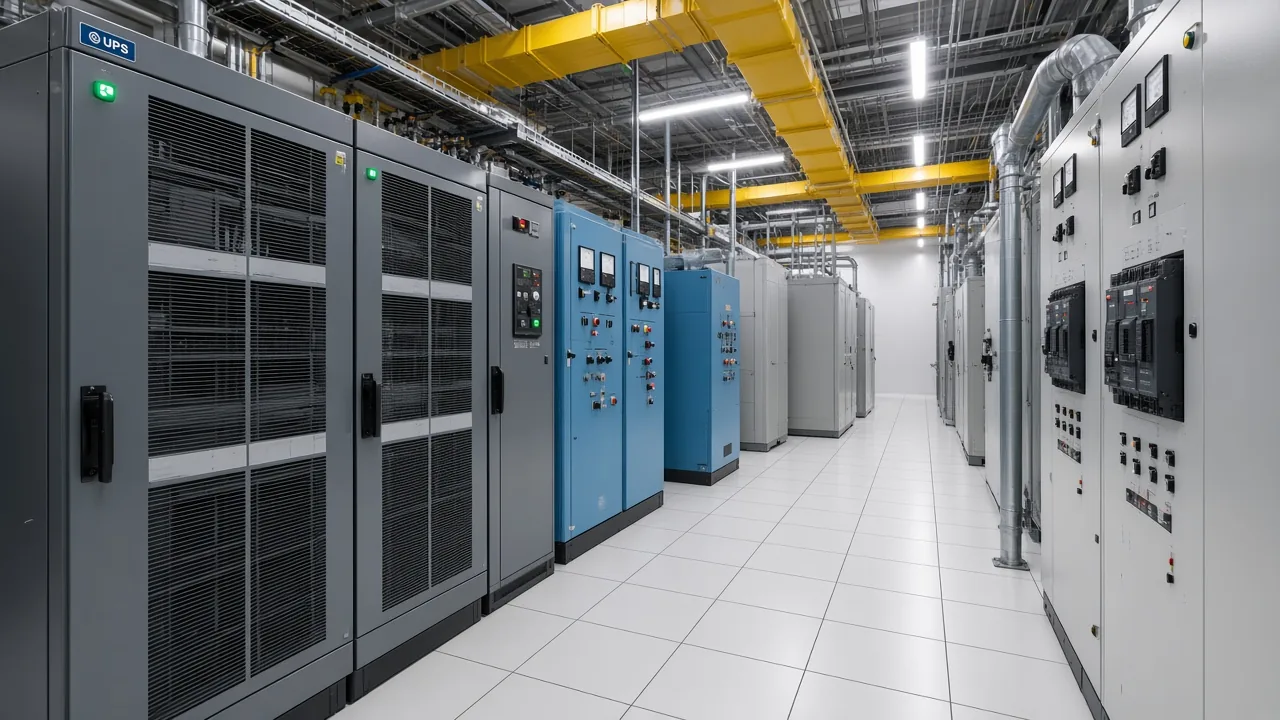
| Measurement cue | Software / meter enough | Hardware class |
|---|---|---|
| Need COMTRADE/PQDIF archive, EN 50160 or IEEE 519 reports, or event forensics | Yes | None yet |
| THD stays high after reports look complete | No | Active power filter (AHF / HYAPF) |
| PF hunts; capacitor steps chatter on a UPS-intensive bus | No | Static var generator (HYSVG) |
| Sag log fills and IT still drops | No | Dynamic voltage restorer (HYDVR) |
| Only cabinet kWh / DCIM bill-back | Yes, different software | Not AHF |
HYAPF injects reverse-phase harmonic current; optional frames are 400 V / 690 V, orders run 2nd–51st, response is under 10 ms, and THD control accuracy is under 5%. An active power filter is a shunt injector of equal-and-opposite harmonic current.
A static var generator injects continuous inductive and capacitive reactive current without capacitor switching transients. HYSVG is specified for data centers and communication stations, with published capacities 50/75/100/200 kvar and full compensation in 10 ms.
When IT still drops after the sag log fills, series hardware injects compensating voltage on the incoming waveform. A sag is an RMS voltage 10–90% below nominal lasting 0.5 cycle to 1 minute.
A swell is 10–80% above nominal for the same duration window. Software timestamps those windows; HYDVR detects an incoming disturbance and injects the required voltage within milliseconds.
Field crews still argue passive versus active after the spectrum is known. Measure first; then pick the class the orders and the source impedance support.
How PCC limits and Class A methods change the software-versus-hardware call
IEEE 519 is a PCC waveform goal; measurement methods say how you capture it; software templates do not meet the PCC by themselves. Mixing those three objects is how a complete report still leaves a dirty handshake with the supply.
IEEE 519-2022 applies voltage and current distortion steady-state limits at the user PCC, the source–load interface, and it addresses steady-state behavior rather than transients. A green IEEE 519 cell in software is a comparison against that PCC goal, not proof the injector already sat on the bus.
EN 50160 appears in many concentrator report templates as a European voltage-quality check. Treat it as a template the historian can score, not a product certification.
IEEE Technology Navigator describes power quality management as measure, analyze, and control so voltage, current, and frequency stay inside limits, and it names active power filters that inject equal and opposite harmonic currents plus DVRs that inject series voltage as the mitigation step after measurement. That control step is the hardware shortlist above.
From the field: the current THD was 32% but the voltage THD was almost 0%. — Electronics Stack Exchange
High current THD on a stiff source can sit beside near-zero voltage THD because voltage harmonics appear when harmonic current drops across source impedance. IEEE 519 still cares about current at the PCC; transformer heating and generator mode can still justify current injection even when THDv looks quiet.
How to select and recommend a data-center hardware path after the software layer
Select the data center and telecom power quality solution when UPS-intensive buses need AHF+SVG hardware integrated with an existing facility PMS. The commercial object after the campaign is that hardware path, published as Solution 1270.
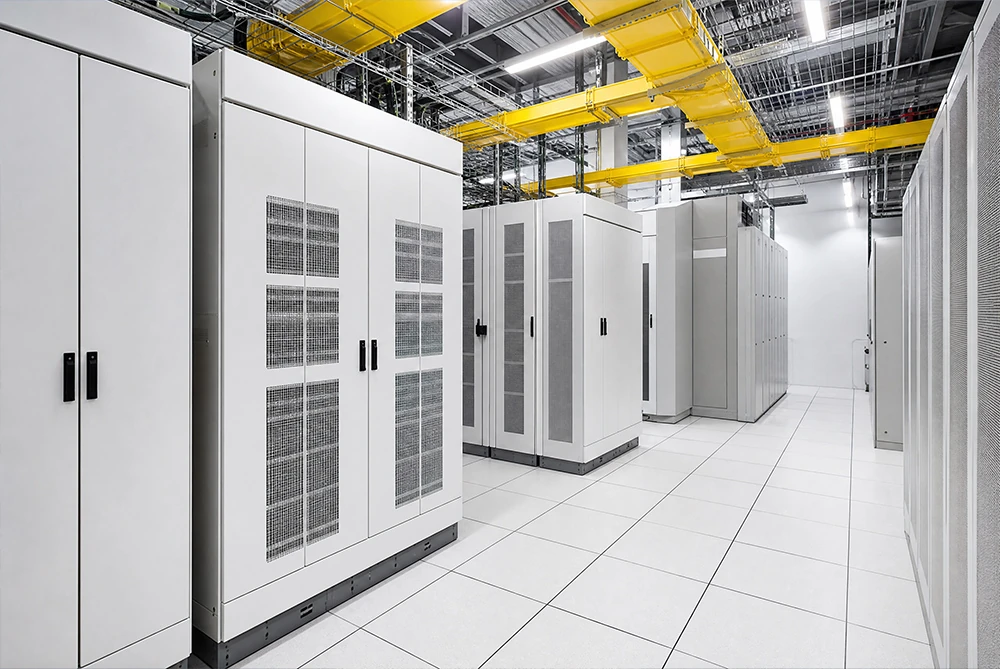
The data center and telecom power quality solution pairs AHF for changing IT and cooling load with SVG for precise vars without capacitor switching steps, distributed by bus section. Monitoring and communication integrate with the facility power-management system the owner already runs.
Stay on meters and archives when the job is only a campaign, a compliance file, or event forensics. Stay on DCIM when the job is cabinet kWh. Shortlist series DVR first when the dominant log is a sag that needs voltage held, using the HYDVR series text path rather than shunt AHF+SVG as the first cabinet.
When measured harmonics, PF, and sag class on the affected section point to shunt injection plus continuous vars, take SLD, transformer and load data, and those PF and harmonic measurements to the same data-center and telecom solution. Class text links remain HYAPF, HYSVG, and HYDVR.
A large-building device-class walk that lists improvement devices rather than this software-versus-hardware split lives on best power quality improvement devices for large buildings.
FAQ
What is data center power quality management software?
It is historian and analytics software that captures, classifies, and reports PQ events, often through an EPMS or a concentrator that stores COMTRADE / PQDIF files. It keeps the record of harmonics, sags, and PF; it does not cancel them.
Does power quality software correct harmonics or only record them?
It only records and classifies them. Opposite-phase harmonic current comes from shunt AHF hardware such as HYAPF, not from a dashboard.
What is the difference between a PQ meter, EPMS, and DCIM?
A PQ meter is the instrument; EPMS is the electrical OT layer that keeps high-resolution events along the incomer-to-PDU path; DCIM is white-space and capacity software, including kWh bill-back. DCIM should consume EPMS rather than replace a filter.
When is software or a rental meter enough for a data center bus?
When the job is a Class A or S campaign, IEEE 1159 monitoring, a compliance archive, or forensics, including a rented logger left on the bus. Hardware waits until those files still show a waveform miss.
When should an active harmonic filter go on a UPS/IT/cooling bus?
When measured harmonic current from UPS rectifiers, IT PSUs, and cooling VFDs stays high after the reports are complete. The cabinet injects equal-and-opposite current on that section.
When is an SVG a better next cabinet than more dashboards?
When vars must move continuously without capacitor switching transients, which is how HYSVG is specified for data centers and communication stations. More dashboards will not stop PF hunt or step chatter.
Can a dashboard replace a DVR for voltage sags?
No. A dashboard timestamps a sag; a DVR injects series voltage while the RMS sits in the sag window.
Is high current THD the same as failing IEEE 519?
No. High THDi with near-zero THDv can appear on a stiff source, and IEEE 519 goals still sit at the PCC for both voltage and current. Read both, plus heating and generator-mode risk, before calling a pass.
Does CHYN sell data-center PQ management software?
No. CHYN’s data-center and telecom path is AHF plus SVG hardware with monitoring integrated into the facility PMS you already have.
References
- IEEE 519-2022 — IEEE Standard for Harmonic Control in Electric Power Systems.
- IEC 61000-4-30:2015 — Power quality measurement methods.
- IEEE 1159-2019 — Recommended Practice for Monitoring Electric Power Quality.
- IEEE Technology Navigator — Power Quality Management.
- Wikipedia — Electric power quality.
- Wikipedia — Active power filter.
- Uptime Institute — Annual Outage Analysis 2025 press release.
- Data Center Knowledge — power as 54% of impactful outages.
- Electronics Stack Exchange — What causes voltage harmonics.
- Electronics Stack Exchange — How to make a power quality analyzer/meter.