
 Zhejiang Hongyan Electric Co., Ltd.

Static var generator response time is meaningful only when the starting event, measured output and finishing criterion are defined. A delay before current changes, the time to reach a target and the time to settle are different measurements. For an industrial SVG purchase, ask for synchronized traces and a test method tied to the offered configuration. A single millisecond value cannot establish how the complete installation handles a changing load. Compare like-for-like control modes, step sizes, operating points and measurement methods before treating one response claim as faster or more useful than another.
Decide which process result matters
Begin with the application. A purchaser may want to reduce reactive-power exchange at the incomer, maintain a selected power-factor target or support a bus voltage. Those objectives can require different test signals and observation points. A fast internal current loop does not automatically describe the speed of the complete installation’s controlled result.
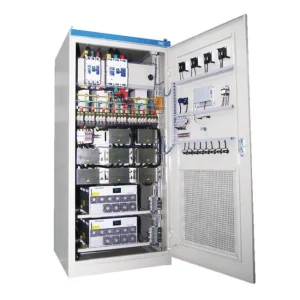
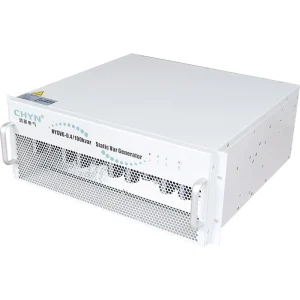
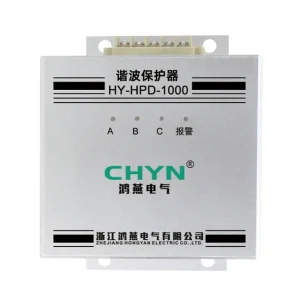
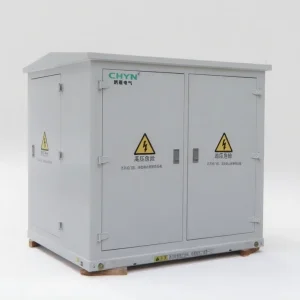
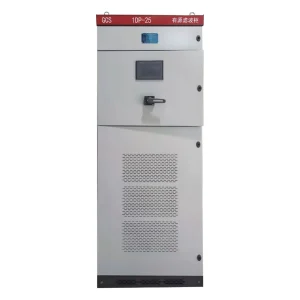
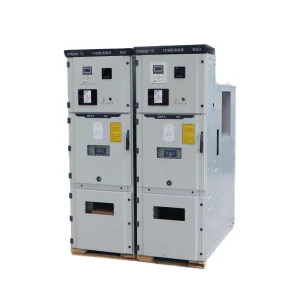
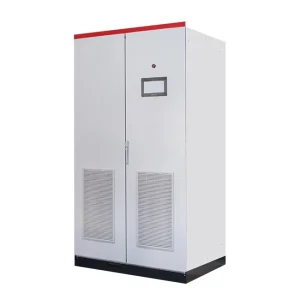
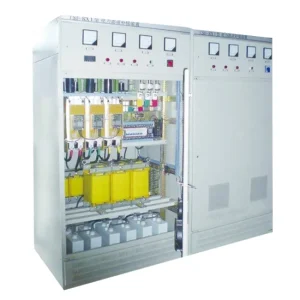
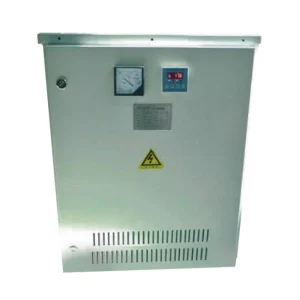
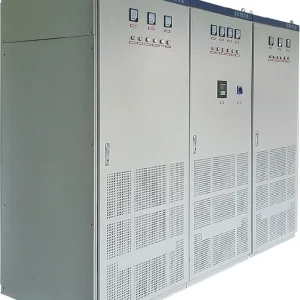
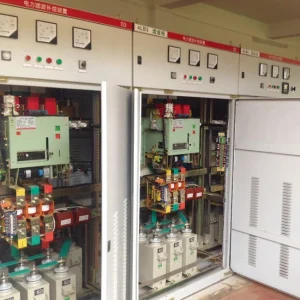
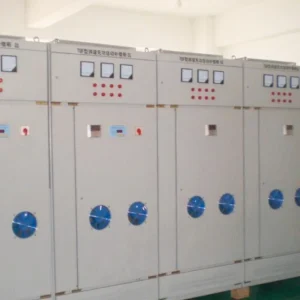
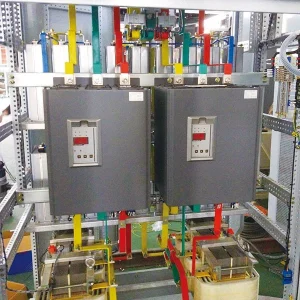
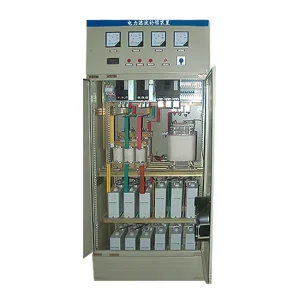
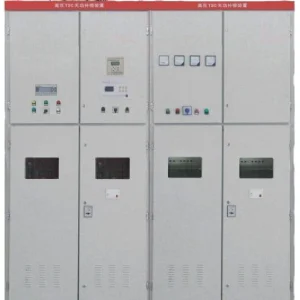
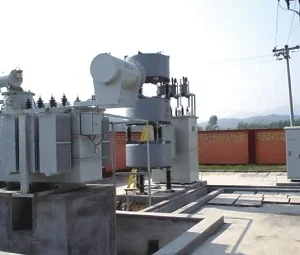
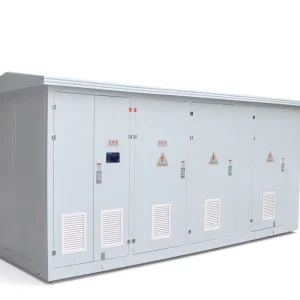
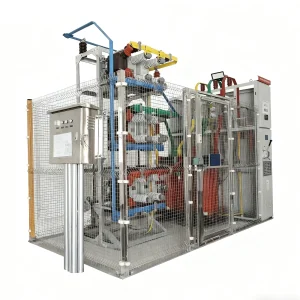
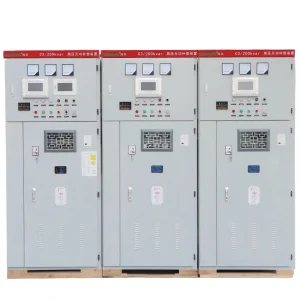
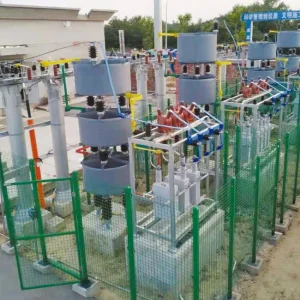
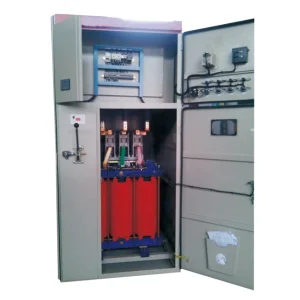
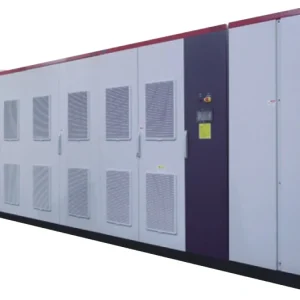
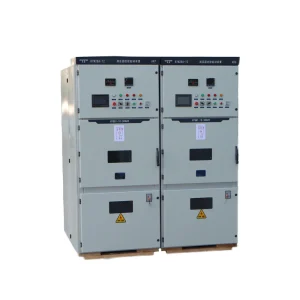
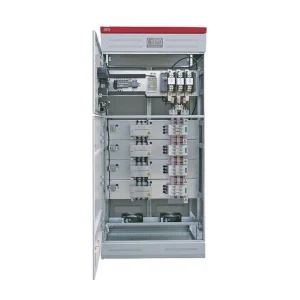
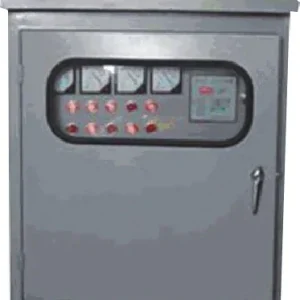
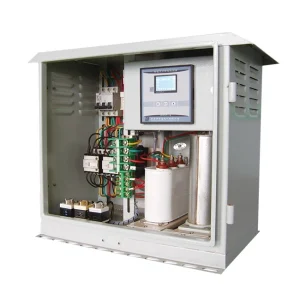
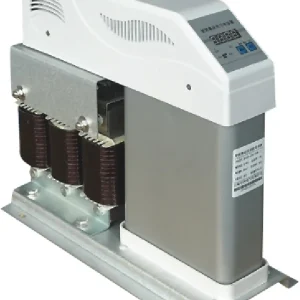
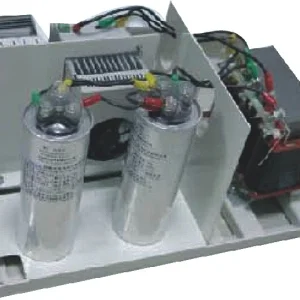
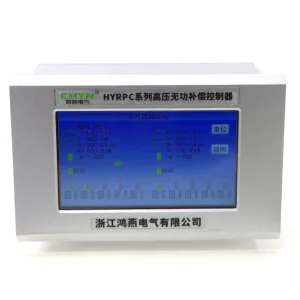
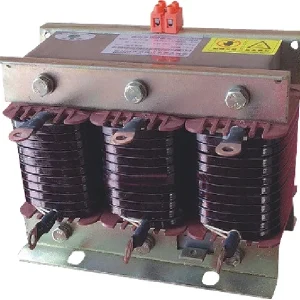
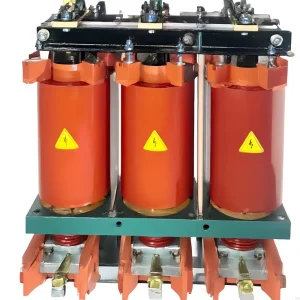
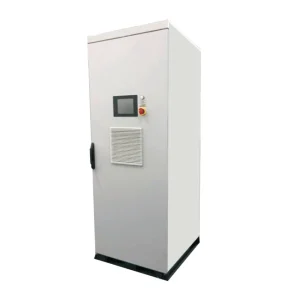
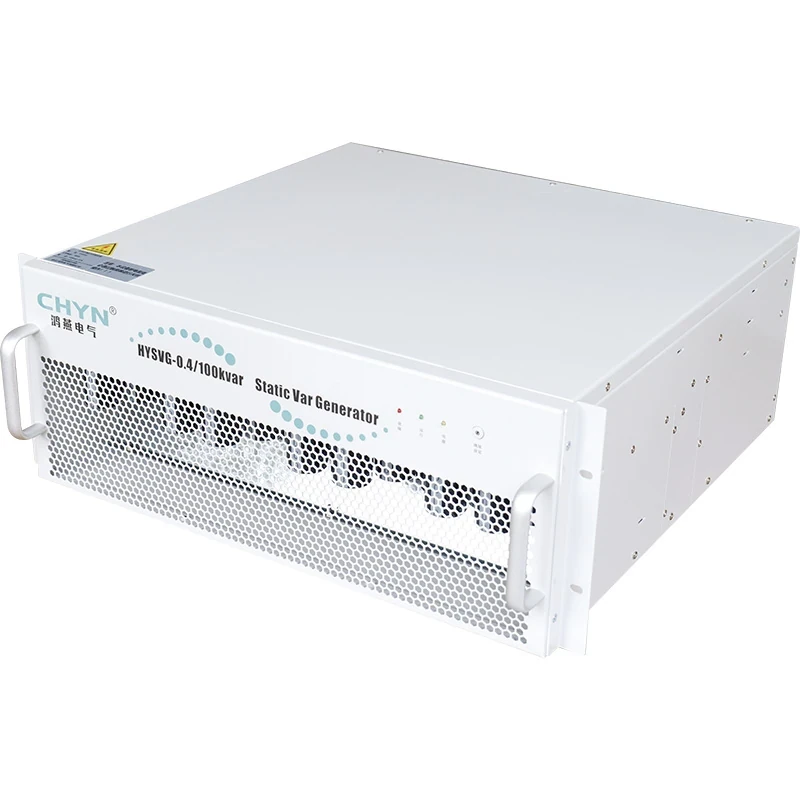
The CHYN HYSVG product page identifies the relevant product family. Request the configuration-specific response definition and acceptance evidence for the offered module or system. The product image does not demonstrate measured speed, software settings or performance at a particular site.
For background on the compensation principle, see what a static var generator does. This guide addresses the narrower purchasing problem of comparing and verifying a response claim. It does not assign a universal response limit to all SVG equipment.
Separate delay, rise and settling
A useful record distinguishes when the disturbance begins, when the output starts to respond, when it reaches the agreed target and when it remains acceptably close to that target. The definitions need to state the measured signal and reference time. Otherwise, two suppliers can report different parts of the same waveform under the same label.
The NERC inverter-based resource performance guideline, Appendix E, separates delay, rise, settling and overshoot for bulk-system STATCOM and SVC behavior. It also explains that response depends on gain and system conditions. That context helps structure a test; its reference targets are not automatic acceptance limits for a low-voltage industrial SVG.
Write the chosen definitions into the request for quotation. If “90 percent response” is used, state whether the clock starts at the applied event or another threshold, and whether the percentage refers to the requested change or rated output. If settling is used, state the permitted band and the observation interval needed to show that the output remains inside it.
| Reported characteristic | Definition to agree before testing | Potentially misleading comparison |
|---|---|---|
| Initial delay | Event timestamp and first measurable output criterion | Comparing controller detection with complete system output |
| Target attainment | Measured quantity and fraction of requested change | Comparing unlike percentages or starting times |
| Settling | Permitted error band and continued observation | Accepting the first target crossing despite later oscillation |
| Overshoot | Reference magnitude and maximum allowed excursion | Reporting a fast rise while omitting excessive excursion |
| System result | Measurement location and coordinated device states | Comparing module current with incomer power-factor recovery |
The table is a practical specification framework informed by the distinction in NERC’s guide. It intentionally supplies no universal industrial SVG pass values; those must be agreed for the actual application.
Make the measured quantity explicit
Decide whether the acceptance record uses reactive current, reactive power, bus voltage or another agreed quantity. Record its sign convention and units. A change from inductive to capacitive duty must be understandable in the trace without guessing which direction the instrument regards as positive.
Power factor can be useful for the operating objective, but it can be a poor sole timing signal when the active load is very small or changes during the event. Ask for the underlying voltage, current and power records as appropriate. An acceptable final power factor does not identify the transient path taken to reach it.
Also identify the measurement boundary. A trace at the module terminals may demonstrate output response, while the incomer trace demonstrates the net installation result. Both can be useful, but they answer different questions. The test plan should state which one determines acceptance and how the other supports diagnosis.
Keep the step inside the available operating range
Specify the starting operating point, requested change and final point. An instruction that drives the unit against a current or thermal limit is not directly comparable with a small response test well inside its available capacity. Ask the supplier to state the available range under the proposed test conditions and how limiting behavior appears in the record.
Include both increasing and decreasing reactive demand when the application requires them. If the process crosses between inductive and capacitive operation, ask whether that transition is included. Do not assume that a successful trace for one direction establishes all other transitions or every installed module combination.
For an installation also providing other compensation functions, document those enabled functions and priorities. The declared response should relate to the duty being purchased. Any shared current limits, operating constraints or functions excluded from the demonstration should be explicit in the supplier’s record.
Record settings and source conditions with the trace
The operating environment belongs with the result. Record the supply arrangement, relevant impedance assumptions, load condition, enabled controllers, measurement configuration and software or settings revision. A clean graph without these details may be impossible to reproduce or compare with the delivered installation.
A research paper on STATCOM evaluation using digital fault recorder data describes the importance of representing external system short-circuit level when reproducing behavior with automatic gain adjustment. Its transmission-system case is not evidence of CHYN module performance. It supports asking which source assumptions and control settings belong to any reported response.
Review interaction with existing capacitor stages or other regulators. The SVG may respond promptly while another controller later changes the net result. Define which devices remain enabled during acceptance, and include enough observation time to identify a slower interaction. Disabling normal plant controls can produce a test that does not represent everyday operation.
Check measurement resolution before interpreting milliseconds
Ask for the recorder’s sampling arrangement, time synchronization and any averaging or filtering applied to the plotted signal. A slowly updated dashboard cannot resolve a short transient just because its horizontal axis is labeled in milliseconds. Preserve the underlying data and the calculation method used to produce the trace.
A practical teaching example is a requested change from 10 kvar to 50 kvar. The total change is 40 kvar; 90 percent of that change corresponds to 46 kvar. This arithmetic merely defines an illustrative target. It is not a CHYN test result, a universal rise-time definition or a recommended step for an operating installation.
If the example trace first crosses 46 kvar and then moves away again, that first crossing still does not establish settling. The agreed band and observation period decide when settling occurs. Conversely, a filtered signal can look smooth while hiding faster behavior. Request a clear account of the displayed measurement rather than inferring timing from a screenshot alone.
Use an acceptance package that can be repeated
Prepare a test sheet with the equipment identity, control mode, starting duty, requested step, source condition, observation point, recorder configuration, timing definitions and acceptance limits. Identify which limits come from the project requirement and which are declared by the supplier. The same sheet should accompany factory evidence and any agreed site demonstration.
Testing requires a competent team and an approved arrangement that protects the installation and connected process. This checklist does not authorize live control changes. Agree the procedure, permissible operating range and stop conditions before introducing a disturbance or changing a setpoint.
For measurement-chain review, use the separate SVG CT polarity verification guide. A wrong reference can undermine automatic control even when the module itself is capable of rapid current changes. For equipment-function boundaries, see the SVG versus active harmonic filter comparison.
At handover, retain the accepted records with settings and device identity. After a controller, CT, source arrangement or major function change, determine which affected tests should be repeated. An old graph remains evidence for its documented configuration; it should not silently become proof for a materially different installation.
Further learning: STATCOM control principles
NPTEL IIT Guwahati’s lecture introduces mathematical modeling of a STATCOM. It provides educational context for the control variables discussed here. The lecture is not a product demonstration, and viewing it does not establish an industrial SVG’s response time.

Watch Lec 33: Basic mathematical modelling of STATCOM on YouTube.
Frequently asked questions
Does the shortest advertised millisecond figure identify the best SVG?
No. First compare the trigger, measured signal, timing definition, operating range and test conditions. One figure may describe detection while another describes settled system output. Select the response that meets the process requirement and require evidence tied to the configuration offered, rather than ranking unexplained numbers.
Is reaching the target once the same as settling?
No. A trace may cross the target and then overshoot or oscillate. Settling requires the output to enter and remain within an agreed band for the specified observation. State both the band and the observation rule before testing, together with the signal and reference timestamp being evaluated.
Can a normal power-factor dashboard verify a very fast response?
Only if its measurement and recording capabilities are adequate for the agreed timing test. Ask about sampling, filtering, update intervals and synchronization. A display labeled in milliseconds does not establish that the underlying data resolves the transient. Preserve the recorded measurements and calculation method used for acceptance.
When should response evidence be checked again?
Review the affected evidence after changes to controls, CTs, source arrangements or enabled compensation duties. Determine which tests need repeating under the approved procedure. A prior waveform applies to its recorded equipment, settings and operating conditions; it should not become automatic proof for a changed installation.